Realising your wind farms’ hidden potential
Windlog provides precise and detailed analysis of individual wind turbines, parks, or entire portfolios. This way, you can make a plan for any corrective measures not just ahead of time, but at the best possible moment.
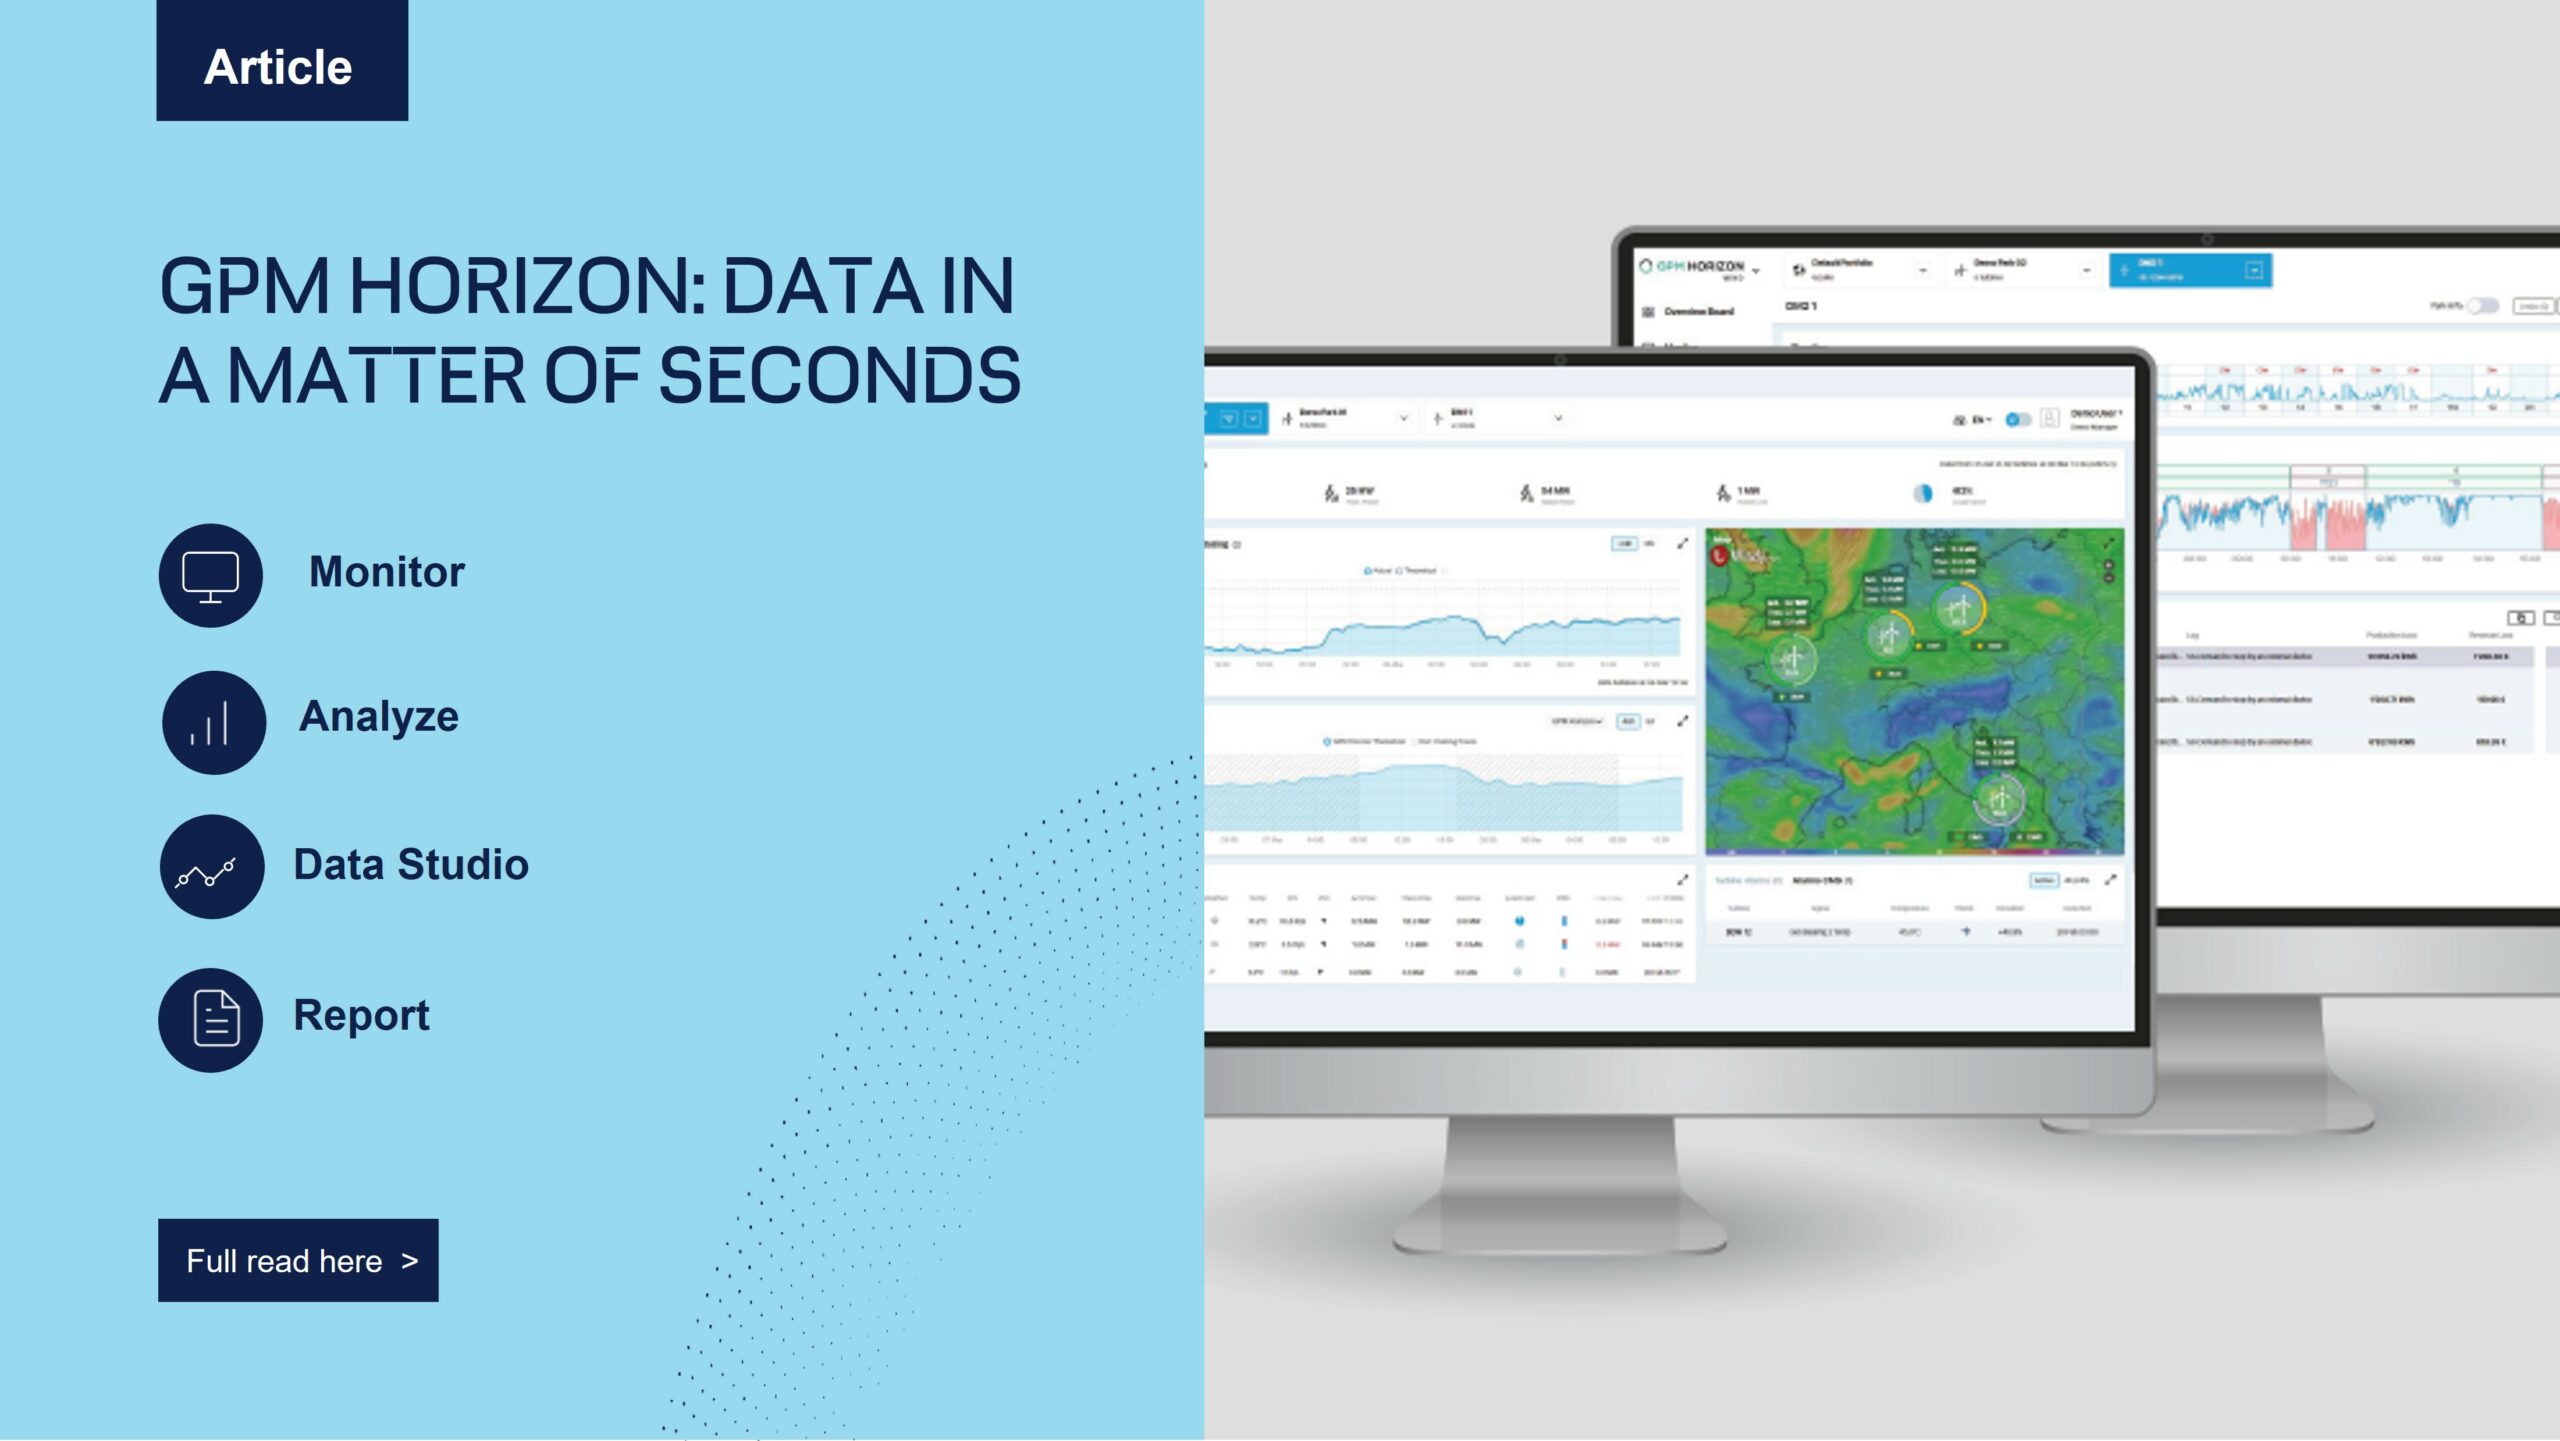
Data in a matter of seconds
Quickly and easily access constructive insights via customizable reports.
Request a demo
Monitor
Track minute-by-minute output from individual turbines, parks and portfolios, effortlessly identifying any issues or anomalous trends.
Analyze
Understand in much greater depth how your turbines and parks are performing over customizable time periods, comparing power curves and being aware of component condition.
Data Studio
This is where you can download any dataset, no matter how specific, either as XLS or CSV files.
Report
You have the flexibility to rapidly customize your daily, weekly and monthly reports, and define your distribution list.

Budget follow-up
Compare actual energy and revenues generated with your expected figures – at park, country and portfolio level.
Check revenues
This is your PPA tracker, where we calculate your revenues using live readings from the grid-meter alongside your PPA’s formula.
Forecast
We use meteorological data and machine learning to project what your actual energy output will be, and therefore what will sell on the market.
Making the numbers add up
Check your production and related revenues, and set budgets more precisely, taking into account actual weather conditions.
Request a demo
Putting you firmly in control
Use cutting edge technologies to supervise, operate and keep a log of your assets and analyze alarms.
Request a demo
Operate
As the asset owner, you can stop, reset and start turbines remotely – simple and secure.
Troubleshoot
Get an in-depth overview of all logbook alarms and warnings, including more information about what is actually stopping turbines and what that translates to in terms of financial losses.
De-Ice
This unique module uses advanced analytics and specific weather forecasts to optimize the heating of turbine blades, avoiding ice formation, and making sure you’re still getting the most energy out of your turbines, even in freezing conditions.
Logbook
Analyze the turbine logbook and automatically assign actual causes to downtimes, so that you can calculate your parks’ contractual availability and save a lot of time.

Get the app
Brilliantly in-depth, real-time information about your assets is only as good as the app you view it on. Once you have your credentials, this app is your fleet at your fingertips, whether you want to see what’s happening right now, or view a year’s worth of data.

A monitoring and supervision digital tool for windparks.
We would love to hear from you. Please feel free to contact us any time and our experts will get back to you.
Enhancing the performance of your hydropower plants
Hydrolog is our tool for understanding your hydroelectric power output. It provides in-depth analysis of your individual machines, plants and entire portfolios, so you’re in the best possible position to identify setbacks and find room for improvement.
Accounting for every liter of water
Extract information about how your hydropower plants are working at any given moment and access and be in control of your data.

Monitor
In real time, keep track of alarms, get a reading of actual water balance and look closely at the performance of individual machines, plants and portfolios, identifying any issues or anomalous trends. Check on your assets via webcam.
Analyze
Get an in-depth understanding of how your machines and plants are performing over customizable time periods by calculating their key performance indicators.
Data Studio
See all of your assets’ performance data at plant or machine level and download them for further analysis using third-party tools.
Report
In our experience, all asset owners need different things from their reports, which is why we’ve made them so flexible. Customize how your daily, weekly and monthly reports are structured, and choose who’s on the recipient list, too.

Budget
Access commercial figures including planned and actual costs and compare them to historical figures – also thanks to an API that interfaces to ERP Systems.
Temporary alarms
This feature enables you to create specific alarms and warnings for dedicated time periods.
Forecast
Compare actual production with forecasted figures, see any power reductions or machine stops and calculate availability declarations to communicate to traders.
Running the numbers
Get a firm and precise grasp on your budget and a clear indication of where your production revenues are, taking into account actual weather conditions.
Request a demo
Your renewable technologies, all in one place
Energylog is our multi-technology dashboard which displays data from your wind, solar, and hydro assets, so you get real-time updates in one single view.
Request a demo